Bacteria reference tree is inferred with FastTree v2.1.10 under the WAG model from the concatenated alignment of 120 ubiquitous bacterial genes (Parks et al., 2018).
Archaea reference tree is inferred with IQ-Tree v2.1.2 under the PMSF model from the concatenated alignment of 53 archaeal genes based on a subset of the "top-ranked marker proteins" from a recent evaluation based on minimizing horizontal gene transfer and optimising the recovery of monophyletic lineages (Rinke & Spang et al., 2020), using FastTree v2.1.10 to infer an initial guide tree.
Sequences are identified using nhmmer v3.1b2 (Wheeler and Eddy, 2013) with the 16S rRNA model (RF00177) from the RFAM database (Kalvari et al., 2018).
From release 220, Average nucleotide identity (ANI) and alignment fraction (AF) values were calculated with skani v0.2.1 (Shaw and Yu, 2023).
Genomes are obtained from NCBI and must meet the following criteria to be included in the GTDB reference trees and database:
- CheckM completeness estimate >50%
- CheckM contamination estimate <10%
- quality score, defined as completeness - 5*contamination, >50
- contain >40% of the bac120 or ar53 marker genes
- contain <1000 contigs
- have an N50 >5kb
- contain <100,000 ambiguous bases
Filtered genomes are manually inspected and exceptions are made for genomes of high nomenclatural or taxonomic significance, e.g. the isolate genome Ktedonobacter racemifer representing the class Ktedonobacteria in the phylum Chloroflexota has a contamination estimate of 11%. Genomes with CheckM contamination between 10% and 20% which pass criteria i and iv to vii are also retained if >80% of all duplicate marker genes are 100% identical as this suggest a large legitimate genome duplication event, e.g. GCF_004799645.1 , a complete isolate genome from the type strain of Natronorubrum bangense .
Each GTDB species is defined by a single representative genome and species assignments established by considering the ANI and AF to these representative genomes (Parks et al., Nature Biotechnology, 2019). Species representatives are re-evaluated each GTDB release with an emphasis placed on retaining representatives so they can serve as effective nomenclatural type material. However, the goal of stable representatives must be balanced with the desire to use high-quality genomes as representatives, the incorporation of changing taxonomic opinion, and identified errors in genome classification or assembly.
GTDB representatives are updated according to two primary principles: i) representatives should be assembled from the type strain of a species whenever possible, and ii) representatives should only be replaced by assembles of suitably higher overall quality. These two principles are quantitatively defined by the balanced ANI score (BAS) given by: 0.5 * (ANI score) + 0.5 * (quality score) where the ANI score is 100 – 20*(100 - ANI to current representative) and the quality score is defined by the criteria given in Table 1.
An existing representative is only replaced by a new representative if it has a BAS >= 10 above the BAS of the current representative. Intuitively, the BAS achieves the goal of stable representatives by requiring a new representative to be of increasingly higher quality (as defined by the quality score) the more dissimilar it is from the current representative (as defined by the ANI score).
Representatives are also updated to account for genome assemblies being removed from NCBI and representatives are updated whenever the underlying assembly is updated at NCBI.
TABLE 1. Criteria used to establish assembly quality score| Criteria | Score |
|---|---|
| Type species of genome | 100,000 |
| Effective type strain of species according to NCBI | 10,000 |
| NCBI representative of species | 1,000 |
| Complete genome | 100 |
| CheckM quality estimate | completeness - 5*contamination |
| MAG or SAG | -100 |
| Contig count | -5 * (no. contigs/100) |
| Undetermined bases | -5 * (no. undetermined bases/10,000) |
| Full length 16S rRNA gene | 10 |
| Many frameshifted proteins according to NCBI | -25 |
Strain identifiers are obtained from NCBI by parsing the 'isolate' and 'strains' fields in the assembly_report.txt, wgsmaster.gbff, and genomic.gbff files associated with each genome.
The names assigned to GTDB species clusters are re-evaluated each GTDB release with an emphasize placed on nomenclature stability. However, names are changed in some cases to reflect changes in taxonomic opinions and/or to correct identified errors in GTDB or NCBI assignments. Species clusters containing one or more genomes assembled from the type strain of a species are named after the species with nomenclatural priority (Parker et al., 2019), with the generic and specific names changed as necessary to reflect any genus level reclassifications in the GTDB. Species names identified as synonyms are provided as separated file in the GTDB repository and updated each release.
Species clusters without a type strain genome are assigned via a majority voting approach based on NCBI species assignments regarded as correct under the GTDB framework. A genome is considered to have an erroneous NCBI species assignment if a genome assembled from the type strain of this species exists and resides in a different GTDB species cluster. A cluster is assigned a name by majority voting if >50% of genomes in the cluster with a GTDB-validated NCBI name are from a single species and >50% of all genomes with this species classification are in the cluster. Otherwise, the species cluster is assigned an alphanumeric or Latin suffixed placeholder name. In order to maximize the stability of GTDB names, placeholder names are not updated to new placeholder names (e.g., Bacillus sp002153395 to B. subtilis_A or vice versa) even if an updated placeholder name might better reflect the current classification of genomes within a cluster.
Species clusters containing an assembly from the type strain of a subspecies or a subspecies satisfying the majority voting criteria will have the subspecies name promoted to the specific name of the cluster in cases where a placeholder name would otherwise be required.
Relative evolutionary divergence (RED; Parks et al., 2018) is used to help delineate taxa above the rank of species. The conceptual idea of RED is that taxa of the same rank should have arisen at the same time in the past. Development of a time-standardized classification was previously proposed for eukaryotes using the fossil record to calibrate taxonomic ranks (Avise and Johns, 1999).
For prokaryotes, establishing the absolute time of divergence for nodes in a phylogenetic tree is challenging as there are few known dates on which to constrain such inferences. Therefore, GTDB uses RED to normalize the relative dates of ranks using an approach similar to that proposed by Wu et al., 2013.
RED provides an operational approximation of relative time with extant taxa existing in the present (RED = 1), the last common ancestor occurring at a fixed time in the past (RED = 0) and internal nodes being linearly interpolated between these values according to lineage-specific rates of evolution (see Figure). RED intervals (equivalent to temporal bands in Avise and Johns, 1999) are defined as the median RED value for taxa at each rank ± 0.1. This approach represents a compromise between strict normalization and the need to define taxa as reproducible monophyletic groups in the reference tree.
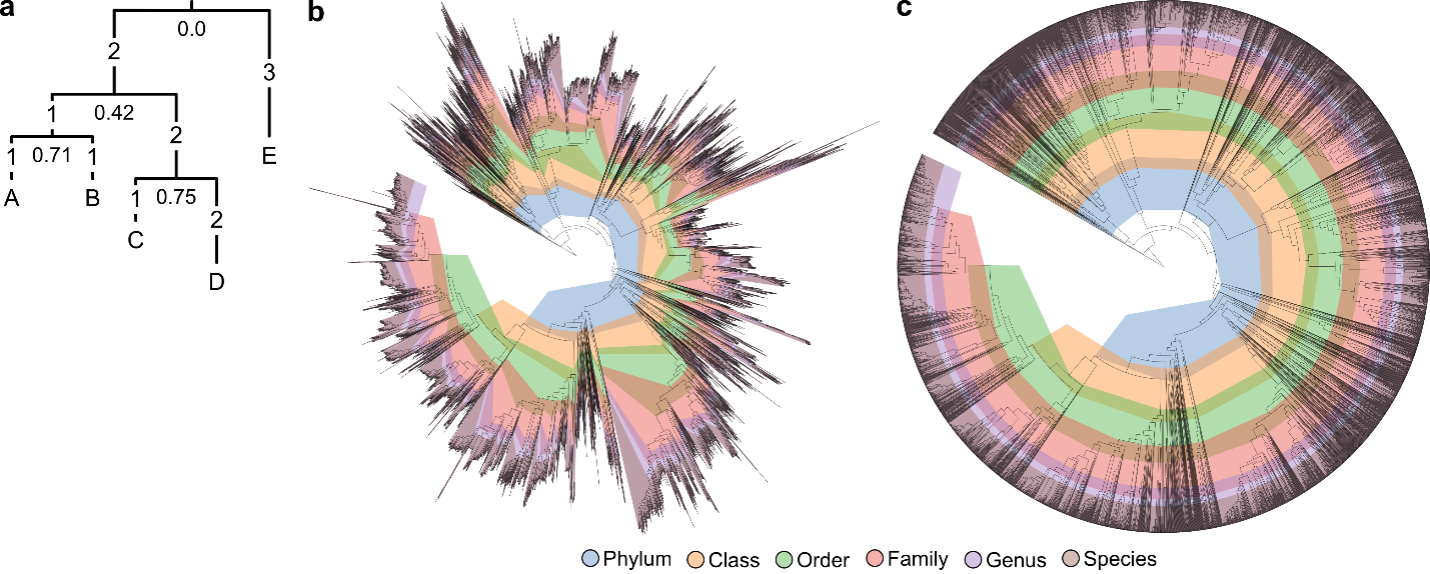
Example of RED calculation. Numbers on branches indicate their length, and numbers below each node indicate their RED value. The root of the tree is defined to have a RED of zero, and leaf nodes have a RED of one. The RED of an internal node n is linearly interpolated from the branch lengths comprising its lineage, as defined by p + (d/u) × (1 – p), where p is the RED of its parent, d is the branch length to its parent, and u is the average branch length from the parent node to all extant taxa descendant from n. For example, the parent node of leaves C and D has a RED value of 0.75 (0.42 + (2/3.5) × (1 – 0.42)), because its parent has a RED of p = 0.42, the branch length to the parent node is d = 2, and the average branch length from the parent node to C and D is u = (3+4)/2 = 3.5. (b) Bacterial genome tree inferred from 120 concatenated proteins and contoured with the RED interval assigned to each taxonomic rank. Adjacent ranks overlap in some instances, because this permits existing group names to be placed on well-supported interior nodes. The tree is rooted on the phylum Candidatus Bipolaricaulota for illustrative purposes. RED values used for rank normalization are averaged over multiple plausible rootings (see Methods in Parks et al., 2018). (c) The bacterial tree with branch lengths scaled by RED values, illustrating that rank normalization follows concentric rings that provide an operational approximation of the relative time of divergence. (Figure from Parks et al., 2018).
Please consult the following GTDB publications for additional information: